
 orcid.org/0000-0002-2777-8707

I finally had some time to learn how to use Tableau. This is a fantastic software with immense capabilities! If you have not heard about it before, make sure you visit this website and download the free software to start developing amazing graphs. I have always been interested in visualising data better and I will start using this tool a lot more not only for my daily job but also to engage better with the readers of this blog.
Here is my first attempt of using Tableau with some data I am collecting sending questionnaire to athletics coaches. This is an online questionnaire I developed to understand the educational requirements of Athletics coaches in Italy as part of an activity of the scientific commission of the Italian Athletics Federation to improve the support to coaches. I have then extended this questionnaire to coaches around the World and plan to make this available online soon for everybody working in any sport in order to experiment some crowd-based assessment of sports science in the real world in various sporting communities around the World. Here are some of the results. I will try to build a questionnaire and link it to a data dashboard for real time updates in the next few days and will launch the questionnaire on this blog and on twitter to see if we can build a map of sports science support in the real world.
I want to make the most of social media and internet capabilities in order to conduct a large scale survey of our profession and also, in the future gather data on other aspects of Sports and Sport Science.
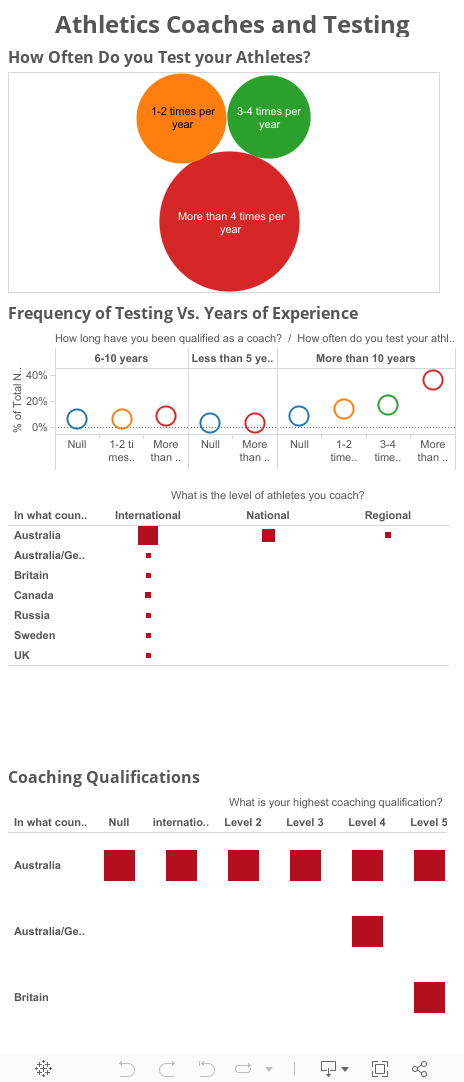
The Tableau dashboard below presents some of the data gathered with the online questionnaire and it is my first attempt at using Tableau, so I hope you like it and I promise to get better at using it!


1 comments:
One of the best tools I have ever used. I love it!
Post a Comment