Showing posts with label Strength testing. Show all posts

Thursday, 12 May 2016

New paper: Physical Predictors of Skeleton Performance

This week I had another paper published. This paper was part of the PhD studentship of Dr. Steffi Colyer in partnership with Bath University, GB Skeleton, UK Sport and my previous role at the BOA.

In this work we looked at the testing battery for strength and power assessment of bob skeleton athletes and identified predictors of skeleton performance. The analysis approach revealed that 3 tests scores can obtain a valid and stable prediction of bob skeleton start performance. More work from Dr Colyer's excellent PhD will be published soon, so follow her work as I am sure more applied approaches in other sports will be followed in the next years. I enjoyed working with a great group of colleagues, athletes and coaches for this project and the publication reminded me of how fortunate I was in my time in the UK.


This project is a good example of how some applied sports science projects can advance understanding of specific performance issues as well as provide meaningful advice for the coaches and practitioners involved in this particular sport.

The abstracts is below:


 2016 May 1. [Epub ahead of print]

Physical Predictors of Elite Skeleton Start Performance.

Abstract

PURPOSE: 

An extensive battery of physical tests is typically employed to evaluate athletic status and/or development often resulting in a multitude of output variables. We aimed to identify independent physical predictors of elite skeleton start performance overcoming the general problem of practitioners employing multiple tests with little knowledge of their predictive utility.

METHODS: 

Multiple two-day testing sessions were undertaken by 13 high-level skeleton athletes across a 24-week training season and consisted of flexibility, dry-land push-track, sprint, countermovement jump and leg press tests. To reduce the large number of output variables to independent factors, principal component analysis was conducted. The variable most strongly correlated to each component was entered into a stepwise multiple regression analysis and K-fold validation assessed model stability.

RESULTS: 

Principal component analysis revealed three components underlying the physical variables, which represented sprint ability, lower limb power and strength-power characteristics. Three variables, which represented these components (unresisted 15-m sprint time, 0-kg jump height and leg press force at peak power, respectively), significantly contributed (P < 0.01) to the prediction (R2 = 0.86, 1.52% standard error of estimate) of start performance (15-m sled velocity). Finally, the K-fold validation revealed the model to be stable (predicted vs. actual R2 = 0.77; 1.97% standard error of estimate).

CONCLUSIONS: 

Only three physical test scores were needed to obtain a valid and stable prediction of skeleton start ability. This method of isolating independent physical variables underlying performance could improve the validity and efficiency of athlete monitoring potentially benefitting sports scientists, coaches and athletes alike.
PMID:
 
27140284
 
[PubMed - as supplied by publisher]

Thursday, 21 April 2011

Nintendo wii fit can be used as a force plate?

Apparently it is possible to use the Nintendo Wii Balance Board as a measurement device. In fact, the Nintendo wii balance board is a simple force platform capable to sampling data at 100Hz.

Balance Board Internals

The Wii Fit offers for a low cost price a simple platform with four measuring sensors and can be used with very little effort as a simple and inexpensive force plate, even without the corresponding game console. Clark et al. (2010) suggested that the Wii Fit balance board could represent a valid cheap solution to measure standing balance. Furthermore they have recently suggested the use of the infrared cameras in the hand controllers as a possible alternative to expensive timing light systems (http://www.jsams.org/article/S1440-2440(10)00913-8/abstract). Recent work from Young et al. (http://www.ncbi.nlm.nih.gov/pubmed/21087865) also suggests the possibility of using this technology for developing bespoke diagnostic or training programmes that exploit real-time visual feedback of current Centre of pressure position.

The Wii Balance Board is certified for 300 pounds (136 kg) in Japan and 330 pounds (150 kg) in the U.S. The Wii Balance Board has four sensors, so each sensor is certified for up to 136 kg / 4 = 34 kg per sensor in Japan or 150 kg / 4 = 37.5kg per sensor in the United States.The following Wii Balance Board calibration information from WiiBrew will make more sense.

If you are interested in Linux, you can see here how to extract the force data. I am sure this is not something useful to measure high performance athletes. However it could represent a fun and simple tool for diagnostic measurements in some populations.

If you have one and are able to use it for this purpose let me know!

Sunday, 5 December 2010

Strength and Conditioning Book

They say better late than ever, in this case it took few years, but eventually the project is now completed and the book will be out on the 17th of December.
It all started with a chat at a conference few years ago with my colleagues and friends Rob Newton and Ken Nosaka discussing the need of a comprehensive textbook on strength and conditioning providing information on the biological bases as well as practical applications.
This book is finally a reality thanks to the help and support of many colleagues who agreed to contribute to this project providing excellent chapters and creating a unique resource which we hope will be well received by anyone interested in Strength and Conditioning.

This book provides the latest scientific and practical information in the field of strength and conditioning. The text is presented in four sections, the first of which covers the biological aspects of the subject, laying the foundation for a better understanding of the second on the biological responses to strength and conditioning programs. Section three deals with the most effective monitoring strategies for evaluating a training program and establishing guidelines for writing a successful strength and conditioning program. The final section examines the role of strength and conditioning as a rehabilitation tool and as applied to those with disabilities.
The book is already available on Amazon and other online booksellers in hardcover and paperback editions.
A big thanks to our production team at Wiley-Blackwell and all the colleagues contributing to the chapters.

Details of the chapters are available here:
Foreword (Sir Clive Woodward).
Preface.
1.1 Skeletal Muscle Physiology (Valmor Tricoli).
1.2 Neuromuscular Physiology (Alberto Rainoldi and Marco Gazzoni).
1.3 Bone Physiology (Jörn Rittweger).
1.4 Tendon Physiology (Nicola Maffulli, Umile Giuseppe Longo, Filippo Spiezia and Vincenzo Denaro).
1.5 Bioenergetics of Exercise (R.J. Maughan).
1.6 Respiratory and Cardiovascular Physiology (Jeremiah J. Peiffer and Chris R. Abbiss).
1.7 Genetic and Signal Transduction Aspects of Strength Training (Henning Wackerhage, Arimantas Lionikas, Stuart Gray and Aivaras Ratkevicius).
1.8 Strength and Conditioning Biomechanics (Robert U. Newton).
2.1 Neural Adaptations to Resistance Exercise (Per Aagaard).
2.2 Structural and Molecular Adaptations to Training (Jesper L. Andersen).
2.3 Adaptive Processes in Human Bone and Tendon (Constantinos N. Maganaris, Jörn Rittweger and Marco V. Narici).
2.4 Biomechanical Markers and Resistance Training (Christian Cook and Blair Crewther).
2.5 Cardiovascular Adaptations to Strength and Conditioning (Andy Jones and Fred DiMenna).
2.6 Exercise-induced Muscle Damage and Delayed-onset Muscle Soreness (DOMS) (Kazunori Nosaka).
2.7 Alternative Modalities of Strength and Conditioning: Electrical Stimulation and Vibration (Nicola A. Maffiuletti and Marco Cardinale).
2.8 The Stretch–Shortening Cycle (SSC) (Anthony Blazevich).
2.9 Repeated-sprint Ability (RSA) (David Bishop and Olivier Girard).
2.10 The Overtraining Syndrome (OTS) (Romain Meeusen and Kevin De Pauw).
3.1 Principles of Athlete Testing (Robert U. Newton and Marco Cardinale).
3.2 Speed and Agility Assessment (Warren Young and Jeremy Sheppard).
3.3 Testing Anaerobic Capacity and Repeated-sprint Ability (David Bishop and Matt Spencer).
3.4 Cardiovascular Assessment and Aerobic Training Prescription (Andy Jones and Fred DiMenna).
3.5 Biochemical Monitoring in Strength and Conditioning (Michael R. McGuigan and Stuart J. Cormack).
3.6 Body Composition: Laboratory and Field Methods of Assessment (Arthur Stewart and Tim Ackland).
3.7 Total Athlete Management (TAM) and Performance Diagnosis (Robert U. Newton and Marco Cardinale).
4.1 Resistance Training Modes: A Practical Perspective (Michael H. Stone and Margaret E. Stone).
4.2 Training Agility and Change-of-direction Speed (CODS) (Jeremy Sheppard and Warren Young).
4.3 Nutrition for Strength Training (Christopher S. Shaw and Kevin D. Tipton).
4.4 Flexibility (William A. Sands).
4.5 Sensorimotor Training (Urs Granacher, Thomas Muehlbauer, Wolfgang Taube, Albert Gollhofer and Markus Gruber).
5.1 Strength and Conditioning as a Rehabilitation Tool (Andreas Schlumberger).
5.2 Strength Training for Children and Adolescents (Avery D. Faigenbaum).
5.3 Strength and Conditioning Considerations for the Paralympic Athlete (Mark Jarvis, Matthew Cook and Paul Davies).

Monday, 21 June 2010

iPhone application for strength testing and training

I have just received a link to a new promising application developed for iPhone/iPod touch capable of using the accelerometer housed in the smartphone to be able applied to barbells for strength testing and for monitoring strength training.

The application is called LIZA and is available here.

It seems clear from the screenshots that it is possible to record the power/load relationship and calculate also velocity of the barbell:

clip_image001

And it seems to also offer the ability to compare tests performed at different times:

clip_image001[5]

After testing is also capable of identifying maximum power and the load corresponding to maximum power output:

clip_image001[7]

A lot more info are also available in real time and as summary feedback to be stored and to be sent via email.

clip_image001[9]

A video of how it works is available here.

It seems a very promising tool for personal trainers as well as for Strength and Conditioning coaches. At the moment there is no information available on the validity and reliability of the power calculations and on the accuracy of the using the accelerometer housed in the iPhone/iTouch. I am sure soon we will see some validation papers on this tool considering the fact that the University of Udine is involved in its development. Also, 1RM is estimated from the load/velocity relationship.

Liza offers also a lite version. According to the website, the lite version allows to perform the half squat test, to view the resulting data and send them via email or twitter just like the standard version; it is not possible to get any graphic representation nor save any data. The lite version displays some advertising banners.

I don’t use iPhone/iTouch, so I suggest the readers to download this application and decide for themselves if it is something worth having. Considering the cost and the fact that you don’t need any extra device, I suggest this is something worthwhile trying for any professional interested in measuring the outcome of strength training programmes.


Tuesday, 29 December 2009

Linear encoder systems: A new kid on the block

In the last few years I have seen many companies develop linear encoder and accelerometry-based systems to measure power output during weightlifting exercises. This is mostly due to the fact that linear encoders and accelerometers are becoming relatively cheap and it is getting easier to write appropriate software routines to perform all measurements.

I have been using for one year the SmartCoach and I am very pleased with what i have seen so far. I have used it mainly for testing purposes and to analyse training sessions and testing sessions performed by strength and conditioning coaches around the country with the remote coaching modality.

The software is simple, easy to use and starts with a very good diary/scheduling system which allows the production of nice training schedules which can be sent to athletes and coaches.

Remote coaching is a great function as it allows a remote coach to write a session or check the content and execution not only in terms of sets/reps/external load but also in terms of power output per repetition.

It really works very well!


The software engineers have recently developed new routines to allow the users to perform strength testing and graphically present the Force/Velocity and Power/Velocity relationships to allow the determination of various parameters useful for strength training prescription.

I am pleased with this product and I recommend anyone interested in visiting the website to download the software for free!

Sunday, 21 June 2009

Training team sports athletes: Periodization and planning strategies. Part 2


Time goes fast and I just realised how long ago I wrote the first part of this article. So, let’s try to start from where I left.

Monitoring training and avoiding mistakes was the topic I left the readers with. Generally speaking, technology in this field is moving very fast and in the very near future I envisage the ability to be able to monitor physiological and behavioural responses to training in team sport in real time, with the ability to make some sensible decisions to optimise training gains in team players.

Heart rate monitoring for example has become nowadays accepted standard practice in the team sports World and also in the Football/Soccer environment nowadays many training sessions are monitored to quantify the effort of the players and the characteristics of the drills employed by the coaches.

In order to quantify training intensity, due to the intermittent nature of team sports, time spent in various intensity zones is quantified. A simple classification is presented and it is based on defining zones with heart rate presented as a % of Heart Rate Max or Heart Rate Reserve.

Of course, in order to have a precise determination of such training zones it is important to measure Heart Rate Max rather then using the 220-age estimation.

Because of the linear relationship between the intensity of exercise and the perception of effort, a simple scale is proposed here:


Table

Heart Rate measurements can be used to define not only the overall intensity of the training session, but also the intensity and demands of individual sessions. This approach allows the coach/S&C coach to develop a database of drills which can impose on the players similar demands in order to be able to change sessions and reduce the boredom factor.

By using Heart Rate based measures in combination with blood lactate it is in fact  possible to compare game-specific drills with more generic drills such as intermittent sprinting and/or repeated sprints and verify the demands on the same player of such activities.

In the following example we can see how intermittent sprint drills (10s activity-20s rest) provided a similar physiological response to 3 vs.3 in Handball players.

image

lactate

This suggests that when training time is limited, the use of well planned technical and tactical drills can represent a significant training stimulus. Of course, what is important to remember is the fact that game-like drills can be effective only if we know how demanding they are. The physiological responses to such drills depend in fact on the rules used in the drills, the space, the number of players and the quality of the players involved. Generalising data findings from other sources is not the way to plan training. In order to successfully implement game-like activities in your training programme requires accurate measurement of the physiological demands in your particular group of players.

In elite team sports athletes it is also effective to plan specific sessions in which game-like drills are combined with more generic repeated sprint drills. A practical example could be to alternate 10 minutes of a game-like drill with repeated sprint drills (such as shuttle runs etc.).

This approach can be very effective and can lead to improvements in aerobic capacity without the need to dedicate too much time to training activities which not involve technical and tactical elements. The following data are the yo-yo test distance scores of an elite handball team performing for one month training sessions characterised by game-like activities mixed with intermittent work.


image 

This is of course only part of the picture. In team sports we want athletes to be able to perform high-intensity movements for the duration of the game, but we also want them to be fast, strong and powerful. Strength training and monitoring activities aimed at maximising gains in this area of the players’ fitness are very important and will be now discussed.

Strength and speed

First of all, we have to take into account what kind of variables we are interested in. Acute variable can help us in understanding how a session is going and how it is affecting the player.

image

Chronic variables can give us more information on how effective a period of training has been and where is our training programme leading to.

image

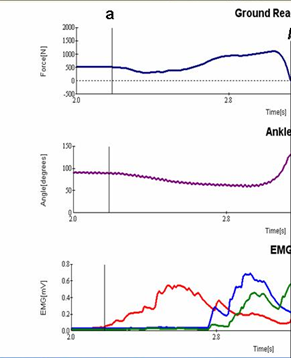
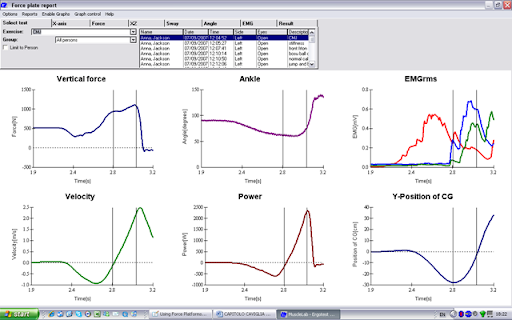
The use of measurement tools to analyse single sessions can be a very useful way to understand how the athlete is coping with the load we have imposed on him/her and also to understand how fatiguing is the session. If heart rate monitoring is important to understand the physiological demands of game-like drills, we need to use some form of monitoring to understand the responses to strength training sessions. Iso-inertial dynamometers are becoming more and more affordable and can provide a good solution. Monitoring strength training sessions offers the following benefits:

image

However the last point is the most important one: if your monitoring activity does not provide data which are useful to improve your training prescription you are just collecting data which will not impact on the quality of training!

The following is a typical example of monitoring a training session using a linear encoder during a Bench Press exercise. Two athletes are lifting the same weight, they both have similar 1RMs, however by measuring their power output during the set we can see how different fatigue patterns occur:

image

If the aim of the session/programme is to maximise power output, we need the athletes to be able to produce power within 90-100% of their maximum power for the given load. By monitoring how they respond (provided that they are encouraged to perform the concentric phase of the lift as fast as possible), we can improve our training prescription by dividing sets and reps to make sure the target power output is attained for the total volume of reps we want the athlete to perform in our programme.

Why such focus on power and speed of movement? Simple, it seems that during rapid movements an increased activation of fast motor units or decreased activation of the slow ones may occur. So, if we aim to improve power and speed in our athlete we should always ask them to perform the concentric phase as fast as possible. The work of Linnamo et al. (2002) can explain in justifying such approach. In their study, Linnamo and coworkers had 6 subjects with different fiber type composition characteristics:

image

This is what you would typically encounter in a team sports scenario. They asked the subjects to perform two types of sessions (explosive and heavy resistance):

[EE] 5 x 10 reps @40+ 6% of MVC

[HE] 5 x 10 reps @67 + 7% of MVC

MVC is the maximal voluntary contraction (measured isometrically).

image image

The difference in the median frequency of the surface EMG (after rectification and fast fourier transformation of the EMG raw signal) between the two modalities of exercise clearly suggest a difference in motor unit recruitment patterns when performing the two types of loading. Note that the sets and reps where the same, with a difference in external load and velocity of movement.

By measuring in real time such parameters it is possible to change the session while it is being performed (again, if the aim of such session is to improve power and speed). The following example from Lore Chiu and coworkers (2004) shows that if you are monitoring the speed of the barbell/weight stack and you observed a decrease in speed, of course by changing the external load you can make sure the speed of execution is increase and is matching what you planned for.

image

The key message here is that we should still plan sessions with sets x reps x load, but we should be able to measure the output in order to make sure the athlete is performing what we require in order to maximise the adaptations and make sure he/she is not wasting time in the gym!

Monitoring strategies to identify recovery and readiness to train

While everyone tends to accept the general adaptation syndrome paradigm, whereby a training stimulus challenges homeostasis and takes a certain amount of time to be recovered. Very few people actually measure what it means and if it is possible to track the various phases of responses to a single training session.


The following approach is an example conducted with an Handball team using vertical jumping tests (in this case the Counter Movement Jump [CMJ]) before, during and after a session of plyometrics (approximately 200 jumps in total). You can see that while the team average score seems to be recovered within 24 hours of such session, some individuals have recovered (BP) and some haven’t (SO). Individualisation should be a fundamental approach to team sports! But if you don’t measure anything…how can you individualise? While everyone talks about it, I still see scarce evidence of this actually occurring, where are the data?


image

Biochemical monitoring of training, long term monitoring of adaptations

I have already presented examples of monitoring training load and adaptations in some team sports showing that different approaches of periodisation can be used depending on the level and the performance goals of the team and both approaches can produce improvements in the players when it counts (http://marcocardinale.blogspot.com/2007/12/strength-training-in-volleyball.html) if you know what you are doing.

Testing modalities and ways of tracking individual and team progress have also been discussed here before. I will spend few words with regard to hormonal monitoring which is now becoming something everyone claims to be an expert in. I recently came across a lot of manufacturers which claim can sell devices able to measure quickly (almost realtime) salivary concentration of hormones (in particular Testosterone and Cortisol) and/or measure hormones in capillary blood.

I regret to inform all readers that to my knowledge there isn’t a single device which provides good reliability and validity of the measures taken, furthermore while measuring such things can be useful, it is still an expensive exercise which requires time and most of all real expertise not only in conducting the necessary assays to measure hormone concentration but also in understanding the validity and the meaning (and most of all the limitations) of the data collected.

To real make and impact, hormonal monitoring should be performed routinely, with many data points during the day, and following strict guidelines in terms of sample collection, storage, preparation and analysis. Collecting only baseline morning fasting hormonal measures might not help in explaining the bigger picture. In the example below, Cortisol levels are presented during the course of the day showing a clear circadian pattern. The Blue line represents “normal” patterns of cortisol secretion. The red and the black line represents alterations I have observed in some athletes following specific training periods. The red and black dots represent the single point, morning fasting sample. As you can see, having only 1 data point might mislead you….as clearly while the subject represented by the black line would appear to have lower cortisol values in the baseline sample, his cortisol pattern is different from normal and his cortisol values are actually overall higher during day and night suggesting some indications of overreaching/overtraining.

image

There is a clear message here. Beware of the so called experts…hormonal monitoring is an interesting field, but still no conclusive evidence on how it actually work, most of all, very few people understand it but many are out there selling all sorts of services and “expertise”. The use of testosterone and cortisol as biomarkers to understand training adaptations is an interesting field but requires the appropriate knowledge of physiology, techniques and limitations in order to be used to make the “right calls” when it comes to training prescription. In the last few weeks I have been working with my colleagues Blair Crewther, Christian Cook, Robert Weatherby and Paul Lowe on an extensive literature review addressing the evidence and implications of the short term effects of testosterone and cortisol on training adaptations and performance. I will keep the readers up to date when such paper is published (hopefully soon).


Conclusions

Writing training programmes is a mix of art and science. The scientific model should drive any inquisitive strength and conditioning coach in designing appropriate and effective programmes. Team sports are challenging in terms of trying to maximise performance with strength and conditioning programmes. They are challenging because of the different types of athletes involved in them, the complexity of the performance requirements and the difficulties of seasons with cups, playoffs etc. The only way to succeed is to approach training with an “evidence-based” attitude. Trying to put in place measurements and monitoring tools able to inform and guide the training process. The devil is always in the details. Group analysis should be followed by individual analysis in order to develop individualised programmes aimed at maximising performance in each single athlete of your team. Statistical procedures should be used to understand and treat the data better, but the attitude towards such approach should be to gain a better understanding of training adaptations rather then trying to find what is significant at P<0.05. As my friend Will Hopkins wrote some time ago:

If a treatment shows an improvement with P<.01 it means that there is a probability of 99% of the treatment being effective.

HOWEVER

If you are terminally ill, would you take a pill that gives you 80% chances of surviving (P<.20)?

In athletics terms…if a training programme can give you 80% chances of a 2% improvement which could win you a gold medal…would you use it…or would you wait for P<0.05?

Tuesday, 18 November 2008

Vertical Jump tests: how to perform correctly the Bosco tests

I decided to write this post after having seen numerous tests reports in which the results of squat jumps appear equal and sometimes higher than the counter movement jumps. This seems to be a common mistake, so I will provide in this post some details on how to execute correctly the tests and how to make sure the results are correct.

First of all, I would like to make clear that it is IMPOSSIBLE that an athlete jumps higher with a squat jump then with a counter movement jump. The simple reason for it is explained in more than 200 research papers which have shown the effect of pre-stretch on muscle performance. It all started from the work of Giovanni Cavagna who described the effects of pre-stretching a muscle on its ability to perform more work during the concentric phase. The stretch-shortening cycle (SSC) can be defined as an active stretch (eccentric contraction) of a muscle followed by an immediate shortening (concentric contraction) of that same muscle.

The increased performance benefit associated with muscle contractions that take place during SSCs has been the focus of much research in order to determine the true nature of this enhancement. Many studies followed the early work of Cavagna, all of which showed that performing a jump with a countermovement (CMJ) produces an higher jump then performing the same from a static position (SJ). The physiological mechanisms responsible for such result have been debated during the years, in particular a special issue of the Journal of Applied Biomechanics in 1997 when a target article received the replies of many experts in the field.

I was very fortunate to work alongside the individual who invented the testing protocol and developed all the formulas and information to use such tests to assess vertical jumping ability: the late Prof. Carmelo Bosco. Prof. Bosco, who was my PhD supervisor and mentor, indicated that he had already suggested in the 80s a combination of mechanical and neural aspects connected to the improvements in jumping ability observed when performing a countermovement. I am not going to discuss the physiological mechanisms in this article, what I really want to do is to provide the following information to everyone using and/or planning to use vertical jump tests:

1) make sure you are aware of the correct testing protocols and make sure you understand the results!

2) if your results tell you that an athlete has a SJ value higher than a CMJ you and/or the athlete or the equipment did something wrong!

Let’s look at the testing protocols now.

Squat Jump

The Squat Jump (SJ) is a jump performed from a starting position of 90 degrees knee angle without allowing any counter movement. The hands are held on the hips during the jump, thus avoiding any arm swing.

How to perform it:

Enter the mat or the force platform. Place hands on the hips, bend knees to 90 degrees and stand still for about 1 second, the jump as high as possible without performing a countermovement.

Squat Jump Bosco

From Bosco (1992)

In the above image, it is clear that the athlete needs to reach the jumping position, and from then just move upwards, rapidly extending the legs and the hips. It is important that no countermovement (pre-stretch) is performed around the knee and hip joints. In fact, if this happens, the jump cannot be considered a “true” and valid squat jump.

An animated clip of a correct execution of the Squat Jump, created by the University of Bourgogne is available here:

http://www.u-bourgogne.fr/EXPERTISE-PERFORMANCE/SJ.htm

Landing Instructions

Independently of the equipment used and the mathematical approach used to calculate the height of rise of the centre of gravity, the subjects should always take off and land in the same position. So the requirement is to land with straight legs and perform a couple of rebounds to avoid injuries. Bending the knees while in the air to land can in fact alter the score by increasing the flight time (more on this later on).

Typical Mistakes

This is a very difficult jumping test to perform. In fact, you will find out that many athletes will perform all sorts of movements before jumping. In particular with the knees, hips and with the trunk. A well executed SJ requires only the full extension of the legs and trunk to take off without previous counter-movements.

Counter Movement Jump

The Counter Movement Jump (CMJ) is performed standing with straight legs and performing a jump beginning with a counter movement down to a knee angle of 90 degrees. The hands are held on the hips during the jump to avoid any effect of arm-swing. Counter Movement Jump differs from Squat Jump by the fact that the starting position is standing still and a quick countermovement is performed (stretch-shortening cycle) before take off. The optimal range of movement for testing should be up to 90 degrees knee flexion. This is an important aspect as normally athlete will perform a very short-range countermovement not resulting in a maximal height of jump.

CMJ Bosco

From Bosco (1992).

As for the SJ, the University of Bourgogne has developed an animation available here:

http://www.u-bourgogne.fr/EXPERTISE-PERFORMANCE/CMJ.htm

Landing Instructions

Independently of the equipment used and the mathematical approach used to calculate the height of rise of the centre of gravity, the subjects should always take off and land in the same position. So the requirement is to land with straight legs and perform a couple of rebounds to avoid injuries. Bending the knees while in the air to land can in fact alter the score by increasing the flight time (more on this later on).

Force Platform vs.. Contact/flight mats

The tests can be performed using the following equipment:

1) Force Platform

2) Contact or infrared mat

3) Accelerometers

I will briefly discuss the differences between the first 2 as they are nowadays the most commonly used methods.

Generally speaking, simpler force plates measure the vertical component of the force in the geometric centre of the platform. Advanced (and more expensive) force plates measure the force at the centre of pressure (COP) and the location of the COP. Finally, the most advanced ones measure all three spatial components of the force vector and torques for the three spatial axes.

image

The above is a typical example of Squat Jump performed on a Force Platform that measures only the vertical component of Force. As you can see, it is possible to calculate no only the height of the jump but also instantaneous velocity and power using the Force/Time trace.

Contact mats and/or infrared mats are simple timing devices that measure fly time and contact time and allow the calculation of the height of rise of the centre of gravity using simple Newtonian laws.

Ergojump

There is an advantage of using a force platform over contact mat to calculate jump height.

1) When using the force platform the height is calculated through integration of the ground reaction force. Therefore it does not matter how the subject lands after a jump on the platform.

2) It is possible to identify Peak Force, Time to Peak force, Rise of Force Development and also it is possible to calculate power and velocity and any point in time

With a contact mat, the height of the jump is calculated from the flight time. If the jumps are performed correctly on the contact mat, the result will however be exactly the same with both methods.

Be aware that the height of centre of gravity measured with the force plate will be slightly different from the jump height given by the contact mat method. The reason is that, in the last few milliseconds just before take off, the toes are still touching the ground. The contact mat will not start to count flight time before the toes actually leave the ground. However, at this stage the centre of gravity has already risen 5-10 cm from the starting position because the subject is standing on her/his toes at the moment of take off.

Calculations

Using the fly time method (valid for both the Force Platform and the Contact/infrared mats) it is possible to calculate the height of rise of the centre of gravity using the following formula:

hcg= Fly Time^2 x 1.226 (from Bosco, 2002)

If using a force platform, the fly time can be identified as the difference between the time of landing-the time of take off as indicated in the following image:

FTIme curve

This is an example of a CMJ. The following phases are identified: a:start of movement; b:take off;, c:landing. The difference between c and b provides the fly time value needed to calculate the hcg.

When the height of CMJ and SJ are determined, it is possible to calculate the % gain from the stretch shortening cycle with the following formula:

% Gain = [(CMJ - SJ) * 100 / (CMJ)]

There should always be a difference between the CMJ and SJ, with the CMJ always being higher. Bosco’s work identified during the years how jumping ability and the effect of the stretch-shortening cycle changes with age in the general population:

CMJ SJ graph

Of course training and performance level can provide higher values than the ones presented above. The main thing to keep in mind is that a CMJ should always be higher than a SJ. If your numbers’ don’t show that, there is something wrong with the test and/or the athlete did not perform a maximal jump.

If any reader is interested in knowing more about calculations when using force plates, a useful article written by Dr. Linthorne (Currently at Brunel University in London) is available for download at this link.

Saturday, 22 March 2008

Using Force Platforms to characterise exercises


Strength and conditioning coaches and Physiotherapists write training and rehab programs choosing various exercises. The choice of exercises depends on many aspects:

- Goals of the programme

- Movement patterns that need to be improved

- Muscle activation patterns of the chosen exercises

- Force production during the execution of the exercises

- Characteristics of the athlete/the sport/ the rehab needs for which they are writing the programme

Pretty much we can say that everyone prescribes a series of exercises for a reason, or at least, to try to obtain a specific goal. Despite this process seems pretty straight forward, it is surprising to find out how many times rehab or training programs are not based on sound progressions. Most of the times such planning mistakes are due to the fact that Force-Time patterns and/or muscle activation patterns of the exercises are unknown. This leads many times to inappropriate choice of exercise and/or inappropriate choice of progression. This problem is particularly acute when the athlete performing the training exercises prescribed is someone trying to recover from injuries.

In this simple article I want to introduce some simple concepts and some examples of how to critically analyse some exercises analysing Force-Time characteristics and muscle activation.

I promise to present more exercises in the next articles in order to provide hopefully some useful information for strength and conditioning specialists and physiotherapists.

I am going to use a simple setup for such descriptions. A Force platform measuring vertical ground reaction force, an electrogoniometer to measure angular displacement in key joints, a surface electromyography [EMG] system to measure muscle activity in key muscles. With this setup and all sensors synchronised I can analyse various exercises and provide a quantitative analysis of the forces produced, the timing of force production, the muscle activity and angular limitations.

The following is an example of data that can be obtained with such setup:

New Picture

We have 3 charts:

- Force-Time Curve in blue

- Ankle-Time Curve in Purple

- Surface EMGrms activity of Tibialis anterior, soleus and gastrocnemius synchronised

The above data represent a recording of a counter movement jump. In point a the athlete is standing still and starts moving downwards flexing the knee joint, in point b the athlete has taken off, in point c, the athlete is landing.

Now, let's look at the details:

New Picture


With this simple approach we can see how the peak force reaches values that are larger than 2 times the person's body mass before take off. We can also see that the ankle contribution is limited to the last phase of take off. In terms of muscle activation patterns, tibialis anterior is very active during the downward phase of the counter movement jump, with soleus and gastrocnemius following similar patterns up until take off.

Looking at further details

image

Soleus and gastrocnemius EMGrms activity has a sharp rise in the moment of inversion of the movement, when the athlete starts to move upwards. Also, peak power output is reached way before full ankle plantarflexion is completed when taking off and also peak force is already reached.

The full movement lasts for 0.91s (from starting the movement downwards to take off).

Let's look at the landing phase now.

image

Ground reaction force (1st graph on the left) and rate of force development (RFD) are very high, actually higher than the force necessary to take off!

Muscle activation patterns are also peculiar, at landing all muscles around the ankle joint are activated in a similar pattern, with the gastrocnemius producing a larger EMGrms activity than the soleus.

So, how do we use this information in terms of exercise prescription? We know that CMJ type of jumps are requiring a force production larger than 2 times the person's body mass, they require a production of force that lasts less than 1 second (of course the above parameters depend a lot on the quality of the athlete tested) and the plantar flexors contribution is limited.

What about landings? As we have seen in this example RFD and Peak ground reaction force are actually higher in landing from a CMJ as compared from taking off. So, if we want to use similar exercises in an athlete that has some issues with the Achilles tendon and/or muscles of the lower leg, we can still do so, making sure he/she is not landing. The obvious suggestion is then to do CMJs jumping onto a box and/or providing a very soft surface to land on in order to reduce force production and RFD.

I hope this makes sense. More to come in the next articles!

Saturday, 8 December 2007

Testing team sports athletes and analysing data

Many strength and conditioning coaches and/or exercise physiologists are nowadays employed to work with team sports. Testing and monitoring training is now becoming standard practice and data analysis, data mining and the ability to produce meaningful reports is a necessary skill of the elite sports science support staff. I this short post I will not discuss the main aspects to consider when performing a test and/or the limitations of testing procedures. I will just present simple examples of reporting data using Microsoft Excel.

 Womens_Football_360x2701

When dealing with large squads, single athlete's scores should be analysed and continuously monitored to make sure the athlete is progressing and improving. However, in order to profile areas of improvement it is important to compare the single athlete to the group or to a known group of elite performers.

A very simple way for doing this with excel is to collect all the data in a single sheet with the name of the athlete in the first column and all the tests scores in the following columns. Then, when the average values and the standard deviation for the team is calculated, all scores of each individual player can be transformed in Z-Scores. In Excel this is possible using the function STANDARDIZE which returns a normalised value from a distribution characterised by mean and standard deviation.

The syntax is the following:

STANDARDIZE(x,mean,standard_dev)

X   is the value you want to normalize.

Mean   is the arithmetic mean of the distribution.

Standard_dev   is the standard deviation of the distribution.

Once each score is normalised, spider charts can be used to see how each individual player scores as compared to the team scores. Two examples are given here. Zero is the team score, every score higher than zero means that the athlete scored better than the average value, every score below zero means that the athlete scored less than the average value.

Figure 1: This is an athlete that outscores the team average values in all tests

image

Figure 2. This is an athlete outscored team results only in sprinting.

image

When we plot the results in this way we can clearly identify areas where we need to make an impact with a training programme. So, while in athlete JL we need to put a lot of emphasis on sprinting abilities, on athlete H we need to do a lot of work on strength and power. With this approach we can then track not only athlete's development in different areas but also how they evolve in comparison to his/her team scores. Individualization of training is the key aspect to take into consideration when working in team sports. Data analysis allows the coach, the physiologist and the sports scientist to profile each individual player and provide appropriate training interventions.

Saturday, 18 August 2007

Strength and Power measurements for strength training planning: what is out there?


It is well accepted that success in most sports depends on the ability of the athletes to exert high levels of strength and power (Stone et al., 1994). For this reason, training programs are nowadays directed to improve those two characteristics no matter what sport the athlete is preparing for. Technology in sport has quickly developed and nowadays many tools are availble to assess an athlete’s strength and power capabilities. Moreover, recent dynamometers provide a form of biofeedback to be able to guide the athlete during his/her strength training program just like heart rate monitors provide guidance during running, rowing and cycling sessions.
Before discussing how to measure strength and power and how to use those measurements to change an athlete’s training program, we need to review some very simple biomechanical concepts.
First of all, strength relates to the ability of an individual to produce force. Force is measured in Newtons (N) and is what is required to stop, start or alter motion. According to Newton’s 2nd law, Force can be calculated as follows:
F = m x a
Where m is the mass and a the acceleration.
Acceleration can be defined as the rate of change in velocity of an object and is calculated as follows:
a = Dv/Dt
Where v is velocity and t is time. Acceleration is measured in m/s2.
When an object experiences a change in position (displacement) it has been displaced and motion has occurred. Since motion has spatial and temporal elements it is important to know the speed and/or the velocity of the object. Specifically, speed defines how fast an object is moving whereas velocity tells both how fast and in what direction the object was moving.
Velocity is calculated as follows:
v= Ds/Dt
Where s is the distance travelled by the object and t is the time needed to cover the distance. Velocity and speed are measured in m/s.
In many short duration events (i.e. sprinting, vertical jump, Olympic lifts) the rate at which muscles can produce mechanical work is often the variable limiting performance. For this reason, knowing how much power an athlete is producing in a given motion could be important to assess the effectiveness of a training program. Power production is measured as the amount of work done per unit of time.
Since mechanical work is calculated as the product of the displacement experienced by an object and the component of force acting in the direction of its displacement divided by the time needed to complete the displacement, it can be calculated in the following ways:
F x s/Dt = F x v
Power is measured in watts (W).
All of the above parameters can be calculated as an average over a range of motion or as an instantaneous value occurring at a particular instant during the displacement of an object.
Enough biomechanics! Let’s start to use it to understand how many commercial systems are using biomechanics to measure Force, Power and Velocity during movements.
Let’s say we want to know how much Force, Power and Velocity a particular athlete is producing while performing a simple weight lifting exercise like the Bench Press. What do we need to do? First of all, we need to know how much is the mass the athlete will be lifting. This will be important as it is a necessary parameter for calculating Force. Secondly, we will need to know how much does the barbell travel and how long it takes to complete the full bench press motion in order to calculate the velocity of the barbell. Finally, since we know the force and velocity, we will be able to calculate the mechanical power produced.
The most common systems currently on the market use very simple technology. The Ballistic Measurement System (BMS, http://www.innervations.com/), Muscle Lab (http://www.ergotest.com/), Real Power (http://www.globusitalia.com/) and others base all the calculations on potentiometers, linear and/or rotary encoders (distance transducers) and accelerometers. Those transducers are attached to the bar (or weight stack track the displacement of the bar or weight stack (See Image) and by inputting the mass of the object tracked, the dedicated software calculates the relevant biomechanical parameters. The information can be provided in real time and stored for analysis.

All the devices used to measure force, velocity and power while performing weight lifting exercises (isotonic or isoinertial movements) are termed isoinertial dynamometers.
How can isoinertial dynamometers help us for designing a training program? In many ways. We can use isoinertial dynamometers to establish the strength and power characteristics of an athlete and compare his/her values with elite athletes and track his/her progression at different phases of the training program. Furthermore, we can use it to assign the training load and also as a biofeedback system to make sure the athlete is moving the weight as fast as he/she can. Also, due to the possibility of applying the position transducers to every moving object, we can test the athletes in open and closed chain type of exercises (i.e. Leg Press vs. Leg Extension). Furthermore, we can measure differences in Force, Velocity and then Power production between limbs.
Let’s do some examples. If we want to establish the strength and power characteristics of an athlete in the upper body, we can measure him/her while performing the bench press with 5 increasing loads (see Figure 2).

For each load we will measure Force, Velocity and Power. The information will be used to plot the Force/Velocity and Power/Velocity relationships (See Figure 3). The curves can be used to identify the lifting load needed to improve strength and power performance. In particular, if we want to identify the training load that maximises the athlete’s power output, we will chose the one that corresponds to his/her peak power. We know that in order to enhance explosive power performance, the load at which the maximal power is obtained must be used for training and the velocity of execution of the exercise used must be always maximal. This approach to strength training has been shown to produce remarkable enhancement of mechanical power (Berger, 1963; Hakkinen, 1994; Kaneko et al., 1983; Moritani et al., 1987).

Following few weeks of training, we can repeat the testing procedure and verify the effectiveness of our training programme and how the athlete is adapting. If the Force/Velocity and Power/Velocity curves are shifted to the right, we have made our athlete stronger and faster (green line, Figure 4), if the curve is the same as before, no change occurred, and if the curve moved to the left, it means the athlete is weaker and slower (red line, Figure4).
Isoinertial dynamometers can be used to detect also overtraining and overreaching, since a decrease in strength and power could be due also to an excess of training load and intensity.
The recent generation of isoinertial dynamometers provides realtime feedback during training. So, just like heart rate monitors providing information and biofeedback about the level of effort exerted by your cardiovascular system, iso-inertial dynamometers can be used to gauge your neuromuscular system during a weight training session. We can measure in real time power output (or how fast the athlete is lifting the weight) and provide feedback to the athlete to move it faster if the speed is too low. Furthermore, we could use the real time monitoring to decide how many repetitions the athlete should perform if we see any sign of fatigue and/or drop in power output. The following is an example of two different athletes performing 10 repetitions with a load equal to 70% of their 1RM. They were both asked to perform the lifts as fast as possible in the concentric phase. As you can see, Athlete A can maintain power output without significant drops for all the 10 repetitions, however Athlete B starts producing less power after the 5th repetition (Figure 5).

How can we use this information? If the goal of the session is to improve power output, then the athlete should perform a number of repetitions in which power output (and velocity of movement) is high, lifting the weight slowly in fact does not help in getting him/her faster and more powerful. Therefore, we can use isoinertial dynamometers not only for testing purposes but also to monitor single training sessions and make sure that the athlete is lifting fast and is producing high levels of power.
Are isoinertial dynamometers valid and reliable? Yes they are, provided that if you are using a linear encoder or another type of position transducer the path of the barbell, dumbbell or weight stack is linear. Few studies have been conducted comparing the parameters calculated by encoder-based systems with the same parameters measured with force plates. During Squat exercises manyh authors have found the measures to be valid and also highly reliable (i.e. Bosco et al., 1995; Rahmani et al., 2001). Also, since the best way to measure your athlete’s progression is to measure Force and Power in the exercises routinely used in training
In conclusion, if you want to measure Force, Speed, Velocity and Power in order to evaluate your athlete’s progression and to identify the proper training load, isoinertial dynamometers are your best option since they allow you to measure every lifting exercise (Barbells, Dumbbells and/or isotonic weight stack machines) with a wide range of loads.
For non linear movements (such as Olympic lifts) it is better to use accelerometers to be able to directly measure the acceleration of the barbell, dumbbell and weight stack and then calculate Force and Power.
However some principles need to be applied when measuring your athletes. If you are planning to repeat the measurements on your athletes, make sure you use the exact same range of motion used in previous measurements, use the same loads used in previous measurements and make sure the mass lifted by the athlete is exactly the same as in previous measurements to avoid that your athletes results in faster scores only because he/she is lifting a lighter barbell!

References:
Berger, R. (1963). Effect of dynamic and static training on vertical jumping. Research Quarterly, 34: 419-424

Hakkinen, K. (1994). Neuromuscular adaptation during strength training, aging, detraining and immobilization. Crit. Rev. Phys. Rehab. Med., 6: 161-198

Kaneko, M., Fuchimoto, T., Toji, H., & Suel, K. (1983). Training effect of differing loads on the force velocità relationship and mechanical power output in human muscle. Scandinavian Journal Sport Science, 5: 50-55

Moritani, T., Muro, M., Ishida, K., & Taguchi, S. (1987). Electrophysiological analyses of the effects of muscle power training. Research Journal of Physical Education, 1. 23-32

Bosco C, Belli A, Astrua M et al. (1995) A dynamometer for evaluation of dynamic muscle work European Journal of Applied Physiology 70: 379–86
Rahmani A, Viale F, Dalleau G, Lacour JR. (2001) Force/velocity and power/velocity relationships in squat exercise. European Journal of Applied Physiology 84(3):227-32

Popular Posts


Followers