Showing posts with label training. Show all posts

Thursday, 27 March 2014

A One-Year Study of Endurance Runners: Training, Laboratory and Field Tests

I have been away form the blog for few months now. The move to Qatar has meant adjusting to life in the desert and learning a lot new relevant aspects of my new job. There are so many things to learn and too many things to do. Sadly the time to update the blog has been less than expected. Abandoning Windos for Mac has also not helped, as I am still trying to find a good software solution to be able to blog more often (if you have suggestions, feel free to email them!). 

Anyway, I want to share the news that finally this paper has been published. This was the result of a lot of hard work from Dr. Andy Galbraith and a collaboration with Professor Louis Passfield's group at University of Kent to make sure we made the most out of the data gathered in the study. Hopefully more data of this study will be published in the future.


Here is the abstract:

A One-Year Study of Endurance Runners: Training, Laboratory and Field Tests


Section: Original Investigation
Authors: Andy Galbraith1, James Hopker1, Marco Cardinale2,3,4, Brian Cunniffe3 and Louis Passfield1
Affiliations: 1Endurance Research Group, School of Sport and Exercise Sciences, University of Kent, Chatham Maritime, United Kingdom. 2Aspire Academy, Doha, Qatar. Department of Computer Science, University College London, London, United Kingdom. School of Medical Sciences, University of Aberdeen, Aberdeen, Scotland.
Acceptance Date: March 18, 2014
Abstract:
Purpose:
 This longitudinal study examined the training and concomitant changes in laboratory and field-test performance of highly trained endurance runners. Methods: Fourteen highly trained male endurance runners (mean ± SD: VO2max 69.8 ± 6.3mL·kg-1·min-1) completed this 1-year training study commencing in April. During the study the runners undertook 5 laboratory tests of VO2max, lactate threshold (LT) and running economy, and 9 field tests to determine critical speed (CS) and the modelled maximum distance performed above CS (D’). The data for different periods of the year were compared using repeated measures ANOVA. The influence of training on laboratory and field test changes was analysed by multiple regression.Results: Total training distance varied during the year, and was lower in May-July (333km [SD: ± 206km], P=0.01) and July-August (339km [SD: ± 206km], P=0.02) than in the subsequent January-February period (474km [SD: ± 188km]). VO2max increased from the April baseline (4.7L·min-1 [SD: ± 0.4L·min-1]) in October and January periods (5.0L·min-1 [SD: ± 0.4L·min-1], P<0.01). Other laboratory measures did not change. Runners’ CS was lowest in August (4.90m·s-1 [SD: ± 0.32m·s-1]) and highest in February (4.99m·s-1 [SD: ± 0.30m·s-1], P=0.02). Total training distance and the percentage of training time spent above LT velocity explained 33% of the variation in CS. Conclusion: Highly trained endurance runners achieve small but significant changes in VO2max and CS in a year. Increases in training distance and time above LT velocity were related to increases in CS.
Keywords: VO2max, critical speed, distance running, endurance, performance changes

Sunday, 8 July 2012

New article on Team GB blog

Time is running fast and soon we will be celebrating the opening ceremony of the London 2012 Olympics. Here is my latest blog on the Team GB website.


image

Monday, 11 April 2011

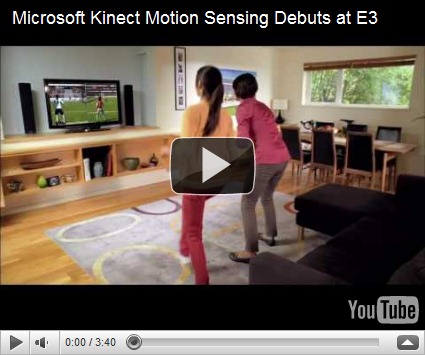
Microsoft gives Kinect starter kit for academic research

This is excellent news. Now scientist will be able to access a software development kit to develop innovative solutions for using Microsoft Kinect a new gaming device developed by Microsoft.

What is special about Kinect? Kinect allows a controller-free gaming. Which means full body play. Kinect responds to how you move as it is a motion sensing, optical device.

If you have never seen one, have a look at the video.


I predict a large number of new applications developed for sports and rehabilitation!

Friday, 22 October 2010

Monitoring training load: Quo vadis? #3

The first two posts dealt with inexpensive and more expensive methods. I will now discuss the use of psychometric tools to get another dimension of monitoring training loads. I have not discussed the use of GPS or similar technologies, but will cover this in the next post.

I really want to present some info on various tools currently used and discuss pros and cons of them.

Profile of Mood States (POMS)

The Profile of Mood States (POMS) is a psychological rating scale used to assess transient, distinct mood states. The original scale, developed by McNair et al, has 65 items describing feelings people have.  There is a brief version,  comprising 11 of the original POMS items, developed by Cella et al, in 1987.  However, this version (Brief POMS) provides only one score for overall psychological distress.  There is yet another version called the short form of the Profile of Mood States (POMS-SF) developed by Shacham in 1983.  The short form version contains 37 items, selected from the original POMS.  It retains the six subscale information provided by POMS. The POM–Bipolar is the newest addition to the POMS. It measures moods and feelings primarily in clinical rather than nonclinical settings. It can help to determine an individual’s psychiatric status for therapy, or be used to compare mood profiles associated with various personality disorders. In nonclinical settings, the POMS–Bipolar can assess mood changes produced by techniques such as psychotherapy or meditation.

Here it is possible to download a POMS scale.

This scale has been used in a variety of populations with more than 2000 studies being performed using it. However there is a paucity of data on athletes and its links to other measures of overtraining and overreaching.

The POMS assessments are self-report inventories in which respondents rate a series of mood states (such as "Untroubled" or "Sorry for things done") based on how well each item describes the respondent's mood during one of three time frames (i.e., during the past week, including today; right now; other). Normative data are based on the "during the past week, including today" time frame. The POMS Standard form contains 65 items and takes approximately 10 minutes to complete. The respondent rates each item on a 5-point scale ranging from “Not at all” to “Extremely”. The POMS Brief form, which is ideal for use with patients for whom ordinary tasks can be difficult and time-consuming, uses the same scale as the POMS Standard form, but contains only 30 items. It takes only 5 minutes to complete. Both the POMS Standard and POMS

Brief assessments measure six identified mood factors:

• Tension-Anxiety
• Depression-Dejection
• Anger-Hostility
• Vigor-Activity
• Fatigue-Inertia
• Confusion-Bewilderment

The POMS-Bi form contains 72 items and uses a 4-point scale. It takes approximately 10 minutes to complete. Responses for the POMS-Bi range from “Much unlike this” to “Much like this”. Unlike the other POMS assessments, the POMS-Bi measures both positive and negative affects. For each of the six bipolar scales, one pole represents the positive aspects of the dimension while the other pole refers to the negative aspects:

• Composed-Anxious
• Agreeable-Hostile
• Elated-Depressed
• Confident-Unsure
• Energetic-Tired
• Clearheaded-Confused

Since 1971, numerous research studies have provided evidence for the predictive and construct validity of the POMS Standard and POMS Brief assessments. Alpha coefficient and other studies have found the POMS Standard and POMS Brief to exhibit a highly satisfactory level of internal consistency, while product moment correlations indicate a reasonable level of test-retest reliability. Factor analytic replications provide evidence of the factorial validity of the 6 mood factors, and an examination of the individual items defining each mood state supporting the content validity of the factor scores. Studies have also supported the bipolar nature of moods measured by the POMS-Bi assessment, and reliability studies have shown that POMS-Bi items demonstrate sufficient internal consistency.

One of the first encouraging studies by O’Connor et al. (1989) examined POMS scores and resting salivary cortisol levels in 14 female college swimmers during progressive increases and decreases in training volume, and were compared to the same measures in eight active college women who served as controls. Training volume increased from 2,000 yards/day in September (baseline) to a peak of 12,000 yards/day in January (overtraining), followed by a reduction in training (taper) to 4,500 yards/day by February. The swimmers experienced significant alterations in tension, depression, anger, vigor, fatigue and global mood across the training season compared to the controls. Salivary cortisol was significantly greater in the swimmers compared to the controls during baseline and overtraining, but was not different between the groups following the taper. Salivary cortisol was significantly correlated with depressed mood during overtraining (r = .50) but not at baseline or taper. Global mood, depression, and salivary cortisol were significantly higher during the overtraining phase in those swimmers classified as stale, compared to those swimmers who did not exhibit large performance decrements.

This was one of the initial studies suggesting a link between increasing training workloads, POMS scores and cortisol responses advocating the possibility of using this psychometric tool to understand how athletes were coping with training loads.

Urhausen et al. (1998) found that the parameters of mood state at rest as well as the subjective rating of perceived exertion during exercise were significantly impaired during overtraining in a follow up study with endurance athletes.

Filaire et al. (2001) used POMS together with endocrine markers to study soccer players and found that in such group decreased testosterone to cortisol ratio does not automatically lead to a decrease in team performance or a state of team overtraining. However, they suggested that combined psychological and physiological changes during high-intensity training are primarily of interest when monitoring training stress in relation to performance.

It seems therefore clear that POMS has the potential to be used to assess how athletes cope with training loads and POMS score can potentially have a link with hormonal  imbalances.

REST Q Questionnaire

The Recovery-Stress Questionnaire for Athletes [RESTQ-Sport] is a questionnaire reported to identify the extent to which athletes are physically or mentally stressed and their current perception of recovery (Kellmann & Kallus, 2000 and Kellmann & Kallus 2001). It has been used by many individuals and organizations throughout the world and can therefore be reasonably estimated to have been used on at least several thousand high-performance athletes as a diagnostic tool to detect under-recovery states and to plan recovery practices. The predecessor of this psychometric tool was a General Recovery-Stress Questionnaire (Kallus, 1995) formulated on the idea that people will respond differently to physiological and psychological demands depending on how well-rested they are when faced with these demands.

The RESTQ-Sport was constructed based on the notion that an athlete well recovered may perform better than one who is under-recovered. However, theoretical and practical concerns governed the methods used to determine the 19 subscales of the RESTQ-Sport (Kellmann & Kallus, 2000 and Kellmann & Kallus, 2001) used an a priori method of identifying each of the subscales, combining to form several scales that reflect various aspects of stress and recovery. The RESTQ-Sport was developed through research in the area of stress for the General Scale, and the Sport Scale was comprised of items observed to coincide with stress or recovery states in athletes (Kellmann & Kallus, 2001).

The test consists of 7 stress scales, and 5 recovery scales.

The scales are:

General stress
Emotional stress
Social stress
Conflict
Fatigue
Lack of energy
Physical complaints
Success
Social recovery
Physical recovery
General well-being
Sleep quality
Disturbed breaks
Burnout/emotional exhaustion
Fitness/injury
Fitness/being in shape
Burnout/personal accomplishment
Self-efficacy
Self-regulation

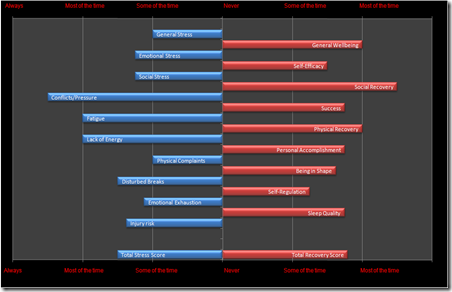
If you are interested in knowing more about this test and have a software to score the results, I strongly suggest you buy Dr. Kellmann’s and Kallus’ book at Human Kinetics. The book also contains a software to score the questionnaire and provide you with a graph.

The graph normally looks like this one presented by James Marshall in his blog:

Figure 1

However, you can develop your own spreadsheet to score it and graph it as I did.
image

Many studies have shown how valid and reliable this test is. However one of the most interesting ones was published by Jurimae et al. (2004). They studied the effects of increasing training loads in competitive rowers and found significant relationships between training volume and Fatigue scores (r=0.49), Somatic Complaints (r=0.50} and Sleep Quality (r=-0.58) at the end of heavy training. In addition, significant relationships were also observed between cortisol and Fatigue scores (r=0.48) at the end of heavy training as well as between changes in cortisol and changes in Fatigue (r=0.57) and Social Stress (r=0.51).

It should be pointed out that this test cannot be performed every day as it asks the athlete about how often the respondent participated in various activities during the preceding three days/nights. A Likert-type scale is used with values ranging from 0 (never) to 6 (always) to rank the frequency of activities/experiences of the preceding 3 days/nights.

BORG scale and perception of effort

The concept of perceived exertion was introduced half a century ago and an operational definition presented with methods to measure different aspects of perceived effort, strain and fatigue. One very common method is the RPE-Scale for "Ratings of Perceived Exertion" ("the Borg Scale") officially known now as the "Borg RPE Scale®".

As Professor Borg explains: “Stevens' "Ratio (R) scaling methods for determinations of S-R-functions have been improved in order not only to obtain relative functions but also direct ("absolute") levels of intensity. This was done by placing verbal anchors, from simple category (C) scales (rank order scales) such as "very weak", "moderate", "strong" etc at the best possible position on a ratio scale, a "CR-scale", covering the total subjective dynamic range, so that a congruence in meaning was obtained between the numbers and the anchors”.

If you are really interested in this you should read Dr. Elisabet Borg’s thesis here where she presents the innovative approach to develop the "Borg CR100 Scale®" (also called the "centiMax Scale"). I had the pleasure to listen to her lecture last year in Italy and I was impressed by the quality of work she has done to follow up her father’s intuitions on the original rate of perceived exertion.

You can read more about Dr. Elisabet Borg here and about Professor Gunnar Borg here.

Recommendations to use a "Borg Scale" is given by many professional societies, e.g. American Heart Association www.americanheart.org, American Thoracic Society www.thoracic.org, American College of Sports Medicine www.acsm.org, British Association for Cardiac Rehabilitation www.bacrphaseiv.co.uk.

These scales can be obtained from the firm: "Borg Perception", Gunnar Borg, Rädisvägen 124, 165 73 Hässelby, Sweden. Phone 46-8-271426. E-mail:borgperception@telia.com.

Other alternatives

There are various tools out there these days such as the following ones:

  • Life Stress (LESCA)
  • State trait anxiety inventory (STAI)
  • Athletic coping skills inventory (ACSI)

however I have no experience in using them…maybe some of you readers know more and what to write comments about any of them?

Enough info now for psychometric tools…next post will cover aspects connected to strength, power and speed.

Tuesday, 12 October 2010

Monitoring training load: quo vadis? #2

After having presented a simple method to monitor training load without the need of expensive equipment, it is now the time to discuss other methods which involve the use of equipment.

The first and obvious one is monitoring training with the use of heart rate monitors. Thanks to the development of technology it is nowadays possible to measure in real time heart rate (HR) of numerous players on the field without the need for them to wear a watch or a recording device. Many companies in fact provide telemetry systems capable of storing and transmitting heart rate values recorded during training and/or competition. When I first started working in this field may years ago I remember the excitement of being able to measure HR during training and be able to download the files for analysis using the conventional heart rate bands and watches. The cost was prohibitive (there was no way I could afford 20 watches + HR bands!), it took ages to download the files with 1 interface connected to a serial port, and most of all, because athletes needed to wear a watch…we had to be creative about where to place it and also be prepared to sacrifice a few in some contact sports or due to falls.

Nowadays, it is very easy! The current systems can transmit information in real time, it is possible to measure many athletes at the same time and it is possible to store and analyse all data immediately after the end of each training session. Furthermore, due to the improved quality of the sensors used and the software and hardware developments, it is also possible to measure R-R intervals and analyse heart rate variability (HRV).


image

Heart rate can be considered as a reliable indicator of the physiological load both for immediate training monitoring and for post-training analysis in almost every sport. However, considering the influence of psychological components like anxiety and stress on HR, it is feasible to suggest that an appropriate assessment of training intensity should also consider this limitation of HR monitoring.

Typical training plans of team sports are characterised by a combination of technical and tactical specific drills, small sided games, or general types of team drills. In the above situations, all members or small groups of the team perform similar tasks. The determination of training intensity and training stress is an extremely important parameter for training planning and for appropriate distribution of training load in elite athletes competing in team sports.

The following methods have been suggested to be effective in quantifying the training load:

The Training Impulse [TRIMP] method

Proposed by Bannister et al. (1975), characterised by the following equation:

TRIMP = training time (minutes) x average heart rate (bpm).

For example, 30 minutes at 145 bpm. TRIMP = 30 x 145 = 4350

This approach is very simple, however it does not distinguish between different levels of training. So it has been used mainly to determine general load in aerobic-endurance sessions.

TRIMP TRAINING ZONES METHOD

Developed by Foster et al (2001)  is based on assigning a coefficient of intensity to five HR zones expressed as a % of HRmax:

1. 50-60% HRmax

2. 60-70% HRmax

3. 70-80% HRmax

4. 80-90% HRmax

5. 90-100% HRmax

The zone number is used to quantify training intensity; TRIMP is calculated as the cumulative total of time spent in each training zone.

For example

  • 30 minutes at 140 bpm. Max HR = 185 bpm. %max HR = 140/185 x 100 = 76%. Therefore, training intensity = 3.

TRIMP = training volume (time) x training intensity (HR zone) = 30 x 3 = 90.

  • 25 minutes at 180 bpm. Max HR = 185 bpm. %max HR = 97%.

Training intensity = 5. TRIMP = 25 x 5 = 125

The zone TRIMP calculation method can distinguish between training levels while remaining mathematically simple, however this can only quantify aerobic training and it does not allow quantification of strength, speed, anaerobic and technical sessions.

TRIMP Zones + RPE

Combining the two methods allows the determination of training intensity not only from a cardiovascular standpoint, but also taking into account the perception of effort and can be extended to strength training to be able to collect a cumulative training load score.

EPOC (excess post-exercise oxygen consumption) Methods

EPOC is basically the excess oxygen consumed during recovery from exercise as compared to resting oxygen consumption. The EPOC prediction method has been developed to provide a physiology-based measure for training load assessment.

EPOC is predicted only on the basis of heart rate derived information. The variables used in the estimation are current intensity (%VO2max) and duration of exercise (time between two sampling points, Dt) and EPOC in the previous sampling point. The model is able to predict the amount of EPOC at any given moment. No post-exercise measurement is needed. The model can be mathematically described as follows:

EPOC (t) = f(EPOC(t-1), exercise_intensity(t), Dt) (Saalasti, 2003)


At low exercise intensity (<30-40%VO2max), EPOC does not accumulate significantly after the initial increase at the beginning of exercise. At higher exercise intensities (>50%VO2max), EPOC accumulates continuously. The slope of accumulation gets steeper with increasing intensity.

(The following figure is from Firstbeat Technologies Withepaper)image

The relationship between measured and HR derived EPOC has been shown to be significantly large suggesting this method as an alternative solution to determine training load with minimally invasive procedures such as wearing a chest band (Rusko et al., 2003).

image

And by the same authors has been shown to be related to blood lactate.

image

The EPOC approach has been nowadays introduced by various HR monitors manufacturers (www.suunto.com and www.firstbeattechnologies.com).

(Figure above from www.suunto.com)

Various manufacturers are now developing innovative approaches to describe training loads based on HR measurements (e.g. http://www.polar.fi/en/b2b_products/team_sports/software/polar_team2_software) and more will be available soon due to the ability for the current systems to record with high accuracy also R-R intervals and derive training stress information from Heart Rate Variability indices.

I will write more on these in the next posts on this interesting topic…this is it for now…stay tuned!

Sunday, 19 September 2010

Monitoring training load in Team Sports: Quo vadis? #1

It is the beginning of the season for many team sports and it is the typical time when sports scientists start to struggle with manipulating the training load and making sure the players can survive a long season producing great performances.

I will try to analyse the current trends in the literature and provide some comments and some possible advice on how to put in place a meaningful and practical monitoring system to be able to inform the coaching process.

It is widely recognised that appropriate periodisation of training is fundamental for
optimal performance in sport. Until recently, it has been very difficult to quantify the
training loads (TLs) in team sports players due to the difficulty in measuring the various types of stress encountered during training and competition. Wearable sensors and well established psychometric tools as well as easy access to field-based biochemistry nowadays allow the collection of various data to be able to quantify and understand the training load as well as track the progression of the players’ performances. This can provide the basis for a critical assessment of the training process and feedback to the players and coaching staff of the progression.

Womens_Football_360x2701

Few comments before discussing the methods for data collection.

Training monitoring is becoming a standard operating procedure for many strength and conditioning coaches and sports scientists which is a good thing. However there are certain aspects that needs to be taken into consideration in order to understand the limitations of some training monitoring approaches as well as the potential of such methods to impact practice.

The latter is the most important aspect to be taken into consideration. Training monitoring becomes a useful thing to do ONLY if guides practice and informs the coaching process. Otherwise it becomes just a data collection exercise. I have seen many S&C coaches use a variety of tools and tests and despite the fact they have some nice continuous data it is clear that such data did not affect practice as training programmes continued in the same way despite the information available on training load and some effects.

So, first rule: training monitoring is a great way to understand how much work your athletes are doing and how they cope with it. Great thing to do only if it helps you in changing and evaluating your training plans.

The other aspect to consider is the limitations of what you measure, when you measure it and how many time  you measure it. All this information helps in understanding what the information tells you and what parameter of your training programme you should change according to the results observed.

Training monitoring needs two main parameters to be measured:

1) The amount of training your athlete is performing (the INPUT)

2) How the athlete is coping with the amount of training (the OUTPUT)

The INPUT can be measured in various ways and should contain some information on how much work the athlete has performed (such weights lifted in each session, distance covered in training and also the perception of how hard the session has been). The list can be more extensive, but frankly your ability to collect more and better data is limited by the equipment you have access to. Heart rate monitors, GPS and accelerometers, power meters in the gym are all available nowadays and allow a lot of measurements to be collected in team sports to help you gain more info on the intensity and the amount of training performed. I have presented few technologies in this blog and aim to do more in the future, so plenty of solutions for you to try.

However, not many people have access to technology (in particular the expensive software and hardware kits for more complex multisensor data collection). So, let’s discuss some simple training quantification methods and their applications.

This will require the use of spreadsheets to facilitate the calculations and the data collection as well as provide you the possibility to create reports and graphs. If you don’t have access to Microsoft ® Excel don’t worry! You can in fact download open office for free from here and have access to a free suite which allows you to have spreadsheets, graphs and presentations at no cost!

The Session RPE method

The session-RPE method of monitoring TL in team players requires each athlete to
provide a Rating of Perceived Exertion (RPE) for each exercise session along with a measure of training time (as suggested by Foster et al., 2001).

To calculate a measure of session intensity, athletes are asked within 30-minutes of finishing their workout a simple question like “How was your workout?” A single number representing the magnitude of TL for each session is then calculated by the multiplication of training intensity (RPE from Table 1) by the training session duration (mins).

Table 1. The modified RPE scale proposed by Foster et al. 2001

RATING

DESCRIPTOR

0

Rest

1

Very, Very easy

2

Easy

3

Moderate

4

Somewhat Hard

5

Hard

6

7

Very Hard

8

9

10

Maximal

Training Load = Session RPE x duration (mins)


For example, to calculate the TL for a training session 60-minutes in duration with the
athletes RPE being 5, the following calculation would be made:

TL = 5 x 60 = 300 AU (arbitrary units)

With a simple spreadsheet it is is therefore possible to track the training load of a team very easily just by recording the duration of training and making sure that each player at the end of each session provides you with the perceived exertion for that session.

Here is an example of what a score of a typical training period could look like:

image

The Black dotted line represents the average Session RPE for the team and each colour represents one of the players. In this way, it is possible to track how the overall training load is progressing and how each individual compares to the team.

The data can also be useful to track down the team’s session RPE and understand if overall the training load is going in the direction planned.

image


Further simple calculations of training ‘monotony’ and ‘strain’ can also be made from
session-RPE variables.

Training monotony is a simple measure day to day variability in training that has been suggested to be related to the onset of overtraining when monotonous training is combined with high training loads (see Foster, 1998).

Training monotony is calculated from the average daily TL divided by the standard deviation of the daily TL calculated over a week.

MONOTONY= DAILY TL/SD of TL over a week

Training strain can also be calculated as follows:

TRAINING STRAIN = weekly TL x monotony

The table below provides a simple example of a weekly training load in a semi-professional handball team with all the variables calculated.

image

Recent work conducted using RPE from 20 soccer players during 67 small sided-games soccer training sessions (Coutts, Rampinini, Castagna, Marcora, & Impellizzeri, 2007a) has shown that  the combination of blood lactate and HR measures during small-sided games were better related to RPE than HR or blood lactate measures alone. This work suggested that RPE is a valid method of estimating global training intensity in soccer. There isn’t such evidence in other sports, however nothing stops practitioners to try and see if it helps with their coaching process.

This is the first article of a series aimed at discussing the issue of monitoring training. I aim to present practical solutions to be able to start quantifying and understanding adaptations in team sports athletes.

Enough for now, time to get your spreadsheets sorted and start calculating what your players are doing so you are ready to apply the techniques presented in the next article!

Thursday, 31 December 2009

Handball and sports science….why so behind?

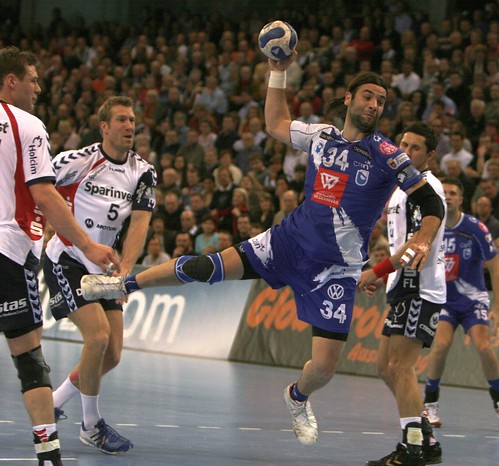
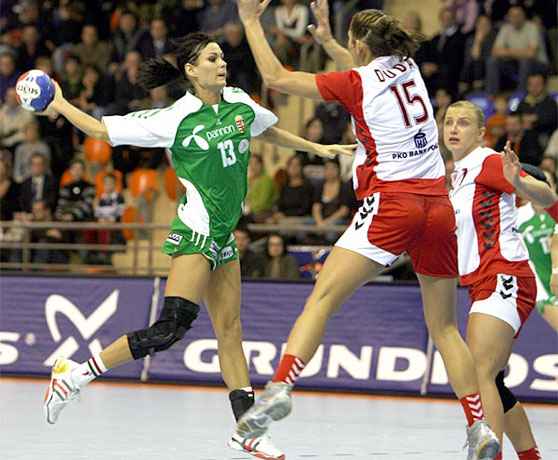
Handball (also known as team handball, Olympic handball or European handball) is a team sport in which two teams of seven players each (six outfield players and a goalkeeper) pass and bounce a ball to throw it into the goal of the opposing team. The team with the most goals after two periods of 30 minutes wins. Handball is by far my favourite sport. I played handball for many years in Italy (a bit more seriously) and for a couple of years in Scotland (for fun) and was a coach for few years and despite the fact I am not coaching handball anymore, I still cannot believe how old fashioned handball training is.

Handball is a professional sport in many countries. In Germany, Spain, Denmark and Norway and many other European countries (mainly in Eastern Europe) there are full time coaches, players and support staff. The European Champion’s League is televised on Eurosport and in some games you can see more than 15000 supporters watching the game! In few words…it is a serious business!

(The Croatian Ivano Balic….possibly the best player in the World for Men’s Handball)

(The Hungarian Anita Görbicz….possibly the best player in the World for Women’s Handball)

If you have never seen a game of handball….you can get some ideas of how it is played on YOUTUBE.

Handball is a sport which is growing very fast in terms of spectators and media coverage, and is one of the top sports in Europe in terms of employment opportunities for coaches and sports scientists. Handball is an Olympic sport since 1972 in its indoor version. However, despite all the media interest, the sponsorships and the fact that Olympic medals are at stake, very little is available in terms of sports science. Very few research activities have been conducted and there is a paucity of published literature. A simple analysis on pubmed using the keyword “Handball” provides 343 entries (with many papers on injury rates and/or on a different sport also called Handball and played mostly in the USA and Canada). A keyword search for Basketball presents 1734 papers, and volleyball presents 693. In simple terms, there is clearly a paucity of information on Handball.

When we then analyse the scientific literature available, we then realise how little has been published on training and performance aspects as most of the literature refers to injuries in Handball.

A very recent review from Ziv and Lidor (Ziv, Gal and Lidor, Ronnie(2009) 'Physical characteristics, physiological attributes, and on-court performances of handball players: A review', European Journal of Sport Science, 9: 6, 375 — 386) has summarised all the available literature on handball and highlighted how little is known about this wonderful sport.

I have previously discussed on this blog specific aspects of physical preparation of handball players. However I would like to point out again that little is known about physiological demands and most of all about physiological characteristics of elite handball players. Ziv and Lidor summarised in Table 1 of their paper what has been so far published:

image

From the paucity of data on elite performers, you can clearly see that elite handball players are bigger and have more muscle mass than non elite. When I worked in Italy we used to benchmark our youth national teams and seniors with the World elite and it was always clear that in order to be World leading in this sport you needed height and fat free mass in particular in some playing positions.

Endurance capacity has always been a matter of discussion in the Handball coaching community. Despite the fact that Handball is clearly an intermittent sport (played on a 40m court!), a lot of attention was always devoted to endurance capacity. However data clearly show that handball players have a VO2max of 50-60 ml.kg.min-1, indicating that probably endurance capacity per se is not the most important performance-limiting factor. This has been supported by one scientific paper published by Gorostiaga et al. In fact, they conducted a study that examined endurance capacity in elite and amateur handball players while running at 10, 12, 14, and 16 km/h found no differences in mean blood lactate concentration or in mean heart rate (Gorostiaga et al., 2005). The mean running velocity and heart rate that elicited a blood lactate concentration of 3.0 mmol. l-1 were similar in both elite and amateur players, suggesting that endurance capacity per se does not differentiate elite from amateur handball players. In addition, no significant differences in endurance running at 10, 12, 14, and 16 km/h were observed in elite players over the course of a season (Gorostiaga et al., 2006). Despite this, a lot of handball coaches still put emphasis on training endurance capacity mostly in the form of long steady state running. However, it is important to state that we don’t have data on the top 5 national teams in the World and we have no idea if they are really different from the rest. Also, considering how fast the game is now played, we should clearly reconsider how to train handball players as I suspect metabolic demands are a lot higher than the ones recorder in the early 80s.

The most recent work on motion analysis characteristics is the one published by Luig et al. (2008) which conducted time-motion analyses during nine games of the 2007 men’s World Cup. The analyses were conducted using a computerized match analysis system. Four movement categories were defined in this study: walking, slow running, fast running, and sprinting. Playing time was significantly higher in wings (37.37 +/- 2.37 min) and goalkeepers (37.11 +/- 3.28 min) than backcourt players (29.16 +/- 1.70 min) and pivots (29.3 +/- 2.70 min). Total distance covered was higher in wings (3710.6 +/- 210.2 m) than in backcourt players (2839.9 +/- 150.6 m) and pivots (2786.9 +/-238.8 m). As anticipated, goalkeepers covered the shortest total distance (2058.1 +/-90.2 m). The total distance covered by field players consisted of 34.3 +/- 4.9% walking, 44.7 +/-5.1% slow running, 17.9 +/- 3.5% fast running, and 3.0 +/- 2.2% sprinting. Compared with other players, wings covered significantly shorter distances while slow running but significantly longer distances while fast running and sprinting. The distances covered are a lot less of what was reported in the 80s and is possibly due to how the game has changed with a better use of substitutions during the game to make sure players can perform fast movements for almost 21% of the total distance covered. To date, no study has been performed on oxygen consumption during handball games, but it is quite easy to predict what to expect considering the fast pace of handball playing. Quite simply, there is no information on handball performance which can help coaches identifying what the real demands are in particular at the very elite end of performance. I am sure data exist possibly in languages I cannot read and understand, I would be in fact very surprised if the elite handball nations don’t have such data to identify what they need in order to win an Olympic medal.

More data exist on strength and power capabilities and how training can influence throwing speed:

image

image

Again, few data here, but it seems feasible to suggest that strength training can improve throwing speed at least in non-elite players. The effectiveness of strength training on improving throwing speed in World class players is debatable mainly because there are no data to support or disprove this possibility. However, considering that Gorostiaga et al found a significant correlation between total strength training time and standing throwing velocities (r=0.58), and with my group we always improved throwing speed in national team players following a strength training programme, it seems feasible to suggest that strength training can improve throwing speed even in elite players. Throwing speed is of course only one part of the story, as accuracy is needed in order to score a goal as well as the ability to “beat” the goalkeeper. Incredibly there is virtually no information on interventions able to improve accuracy in handball players….

Handball is quite a demanding sport and being a “contact” sport eposes the players to a relatively high risk of injuries. Data from Beijing Olympics (Junge et al. 2009) clearly shows the high injury rates observed in Handball. 92% of the injuries occurred in competition. Of course during the Olympics teams tend to lower the intensity of training sessions and minimise physical contact in order to avoid injuries. However, it would be interesting to investigate injury rates in training and competition to find out if training sessions are too far from the competition demands as I suspect this is the case in many countries.

image

Who is going to invest in research activities on handball performance? Which country will be able to identify marginal gains to produce better players? Which country will be able to identify nutritional strategies to maximise performance in handball?

Maybe in few years we will have an answer, in the meantime, we can enjoy the competitions and hope that more research activities will be published on peer reviewed journals and websites for the good of coaches and players.

Wednesday, 23 December 2009

Playing videogames and social networking….good news or bad news for sports people?

It has become a matter of discussion in recent years and most of all a matter of concern for most of us working in sport: video games. Athletes nowadays travel with their playing consoles around the World, spend a lot of time updating their social network sites and personal websites, watch DVD and do all sorts of things in their “downtime” which are totally different from the old times when they used to go out for a walk, play cards and/or read.

Times change, habits and behaviours change and we are all totally taken by the fast advancements in technology which nowadays provides us also with entertainment tools so small that they are able to travel with us.

Image copyright (http://sarah-land.ning.com/)

While the use of such tools can be seen as a useful way to keep the athletes “indoor” and avoid the dangerous temptations of wondering outside the hotels and training camps facilities, we should have a more critical approach to the problem and try to understand how we can control the use of technology to make sure that it does not become “abuse” and it starts to impair performance.

I would like to discuss few examples and provide the rationale for my thinking. Ideally I would like to stimulate some discussion and possibly stimulate some research activities in this area, as I strongly believe it needs investigation as I have seen some quite spectacular effects of athletes playing all night with videogames and messing up their training and/or their competitions!

First of all then, let’s discuss video games.

My suggestion to all athletes travelling to Beijing last summer and to all athletes travelling to Vancouver this winter is to avoid at all costs playing video games, watching DVDs, using computers at night if they wake up because of Jet Lag. My rationale is pretty simple. In order to quickly recover from Jet Lag we need to make sure that sleep occurs at the right time of the day-night cycle. Most of the times, some athletes don’t consider getting help from sleeping tablets and tend to tackle the issue with bed routines. However, when they wake up at 3 am with their body thinking it is time for lunch or dinner, they should make every possible effort to avoid being exposed to light and should make every effort to get back to sleep. Why that? Playing a video game on a computer or game console, using a laptop for social networking and watching a DVD can expose you to up to 300 nits (unit of measure of luminance) of light. The pattern of light is also strong and intermittent.

Light exposure through the visual field has been shown in various studies to stimulate brain areas leading with circadian control and the pineal gland dealing with hormonal pulsatility. Circadian rhythms in physiological, endocrine and metabolic functioning are in fact controlled by a neural clock located in the suprachiasmatic nucleus (SCN).

(Image from “The New Genetics”, US Department of Health: http://publications.nigms.nih.gov/thenewgenetics/thenewgenetics.pdf)

This structure is endogenously rhythmic and the phase of this rhythm can be reset by light information from the eye. It is therefore possible that if somebody is exposed to light of the intensity produced by laptops and similar tools coupled with physiological and psychological arousal generated by the interactive nature of the tools (e.g. video games and social networking chats) might delay adaptation to the new time zone. In simple terms, this is pretty much because light exposure is telling your brain it is time to wake up! In humans, bright light exposure early in the biological night delays circadian timing, while bright light exposure late in the biological night advances circadian timing (Khalsa et al., 2003). However, the levels of light exposure employed to shift the circadian clock have typically been fairly high, ranging from 2,500 – 10,000 lux (Crowley et al., 2003; Czeisler et al., 1990; Horowitz et al., 2001), far above the lighting received by a Laptop screen. However usually laptops and video games use is associated with physiological and psychological stress which could contribute to altered sleep patterns not only in jet-lagged subjects but also in athletes in a training camp that have not crossed any time zone.

The effects of light are not the only concern. Playing certain video games has been shown to have some interesting physiological effects. Children playing Tekken 3 (Namco Hometek Inc) where shown to have Significant increases from baseline for heart rate (18.8%; P<.001), systolic (22.3%; P<.001) and diastolic (5.8%; P=.006) blood pressure, ventilation (51.9%; P<.001), respiratory rate (54.8%; P.001), oxygen consumption (49.0%; P<.001), and energy expenditure (52.9%; P<.001). Effect sizes for these comparisons were medium or large. No significant changes were found from baseline to after video game play for lactate (18.2% increase; P=.07) and glucose (0.9% decrease;P=.59) levels (Wang & Perry 2003).

image

Children playing for 60 minutes Need for Speed—Most Wanted (Electronic Arts, Redwood City, CA presented impaired sleep patterns and a reduction in verbal cognitive performance (Dworak et al. 2007).

Despite the fact that a violent video game (Over 85% of games contain some violence, and approximately half of video games include serious violent actions [e.g., Children Now, 2001]) does not seem to determine an increase in cortisol levels (Ivarsson et al., 2009) it is clear that it is capable to provide enough physiological and psychological disruption to a normal sleeping pattern. The disruption of normal sleeping patterns can be deleterious in an athelte trying to get into a normal sleep routine after having crossed few time zones.

The smaller video game literature has found that playing violent video games causes increases in aggressive behaviour, aggressive cognitions, physiological arousal, and decreases in prosocial behaviour (Anderson et al., 2004).

Ivarsson et al (2009) showed a strong influence of violent video gaming on heart rate variability indices. In particular total power and very low frequency of the r-r intervals was shown to be higher while playing a violent video game as compared to a non-violent one.

At the moment there is no study which has been looking at the effects of playing computer games at night on performance. However all the information I cited before seems to suggest some marked negative influences in particular if the athlete is travelling to a new time zone.

So, what is the advice then?

1) If your are travelling to a trainining and competiton venue and are crossing time zones, avoid using your laptop, DVD player, Ipod and similar tools and video games devices during the night. Get back to sleep!

2) If you are training and or competing the following day, avoid all of the above the night before such activities (training and competing) take place

3) Recovery time is meant to be for rest and piece. You don’t want to play street fighter with your best mate and have your blood pressure, heart rate and cortisol levels go sky high because you lose!

4) There is a time and place and most of all a duration for your gaming and computing activities, make sure you don’t negatively affect your performance because of that!

Saturday, 27 December 2008

Talent alone is not enough.


I just finished reading a very exciting book written by Malcom Gladwell entitled:”Outliers”.

Outliers is a provocative and inspiring book aimed at trying to explain what makes exceptionally successful people. Malcom Gladwell examines everyone, from business giants to scientific geniuses to sports stars. This very interesting book argues that the main reasons behind success in every field are:


- People life’s choices, culture and opportunities

- Practice (where he refers to Ericsson’s 10.000 hours rule of deliberate practice, click here if you want to read more about this)

- Luck (everyone needs to be in the right place at the right time)

- Cultural heritage (who do you think you are…where are your genes/experiences/values coming from?)

The conclusion is that great people are the result of an incredible talent mixed with a fortunate array of opportunities they have been given. The sports-specific consideration that Gladwell makes is related to observation of specific patterns in Canadian Hockey players. In particular, he focuses on the fact that most elite Canadian hockey players are born between January and April of any given year. Something to do with cut-offs for age-classes happening on January 1 of every year. Pretty much he discusses the fact that selection in Canadian hockey is more based on maturation. Something that he could have expanded a bit more I have to say.

Gladwell’s most interesting remark is that social forces largely explain why some people work harder when presented with exciting opportunities to succeed and improve. This is why Chinese people work very hard and American kids are raised with a fanatical devotion to meritocracy [something clearly missing in Italian kids….but this is probably material for another book!].

Most successful people have a phenomenal ability to focus their attention, they have an incredible ability to formulate strategies in order to resist impulses and they have incredible resilience. This is so true of champions. Champions are outliers, people with incredible skills, individuals able to see things faster and clearer than others, people able to move, jump, throw better than others. However as Muhammad Ali stated “Champions aren't made in gyms. Champions are made from something they have deep inside them: A desire, a dream, a vision. They have to have last-minute stamina, they have to be a little faster, they have to have the skill and the will. But the will must be stronger than the skill”.

Sport Outliers are special people, they are the ones winning gold medals at the Olympic games, the ones winning the six nations, the World championships. The talent needs to be there, but a part from culture, luck and social forces, what kind of opportunities can Sports Science provide? In many cases, the bests sports scientists tend to work with elite senior athletes and in many sports there is no cascade/adaptation of best practice to junior athletes and coaches and support staff working with development athletes. Can sports science make a difference at a very early stage of athletic development? Also, how many talents have been lost because of poor opportunities?

Without practice, training, and the right opportunities (i.e.access to best resources/facilities/advice/coaching and sports scientists?) success in sport can only be a chance of occurrence?

Monday, 31 December 2007

Recovery and regeneration: what is happening in elite sport?

In the last few years I have observed a steep increase in interest versus recovery and regeneration strategies.

Athletes train and compete a lot these days and everyone feels the need to provide recovery and regeneration strategies to speed-up return to optimal functions.

I have to say that the quality and the science behind most of the recovery modalities is quite questionable and most of the times, the appropriateness of such modalities, could really be a matter of serious debates.

It is not the aim of this article to discuss recovery and regeneration, I promise I will write a more detailed article on this topic in the next few weeks.

In this article I would like to write about the fact that many elite training centres and Olympic associations are investing a lot of money into recovery and regeneration centres aimed at helping athletes.

In september 2006, the USOC opened a New Athlete recovery centre investing a lot of money in conventional and non-conventional recovery modalities/devices (http://usocpressbox.org/usoc/pressbox.nsf/6272c9a938d3a5cb8525711000564abd/aad006ac4a40193e852571ea0068b36d?OpenDocument).

The Australian Institute of Sport (AIS) recently spent 3.5 AUD millions to create the new Recovery Centre (http://www.ausport.gov.au/journals/ausport/Vol3no2/32new_ais.pdf) to provide this service to Australian Athletes.

The Japanese Olympic Association is also building a new site where recovery services will also be provided.

Many leading countries are investing in this area, however research in the most common recovery modalities is scarce or of poor quality. I expect an increase in the number of research studies in this area and I can already anticipate that many modalities currently used by famous athletes/teams will be shown not to be as effective as advertised!

Popular Posts


Followers